The pump stop transition process is a common, large-fluctuation event in pump station operations. This process lasts for a short time and is often accompanied by violent pressure fluctuations and frequent changes in flow state. After the pump stops, the outlet valve closes quickly, playing a key role in interrupting the flow. Simultaneously, the valve's closing process is often accompanied by violent changes in the flow field, as well as vortices, cavitation, and water hammer, all of which threaten the safe operation of the pump and water delivery system. Therefore, studying the outlet valve's behavior during the pump stop transition process is crucial for ensuring the safe operation of the pump and water delivery system.
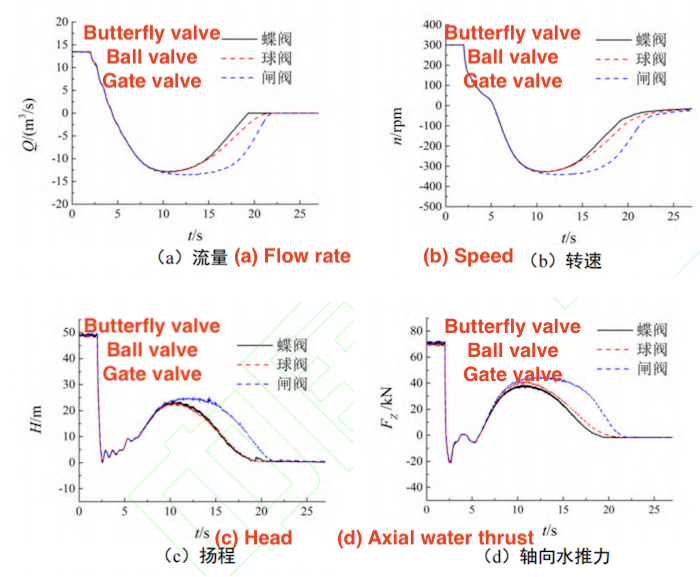
Figure 4 shows the variation of various parameters during the pump stop process with different outlet valve types, under the rated valve closing time, primarily focusing on the flow rate (Q), speed (n), head (H), and axial water thrust (Fz), with the positive direction of the blade axial force defined as downward. When the outlet valve is a
butterfly valve, the pump stop transition process proceeds as follows: after the centrifugal pump is powered off, the outlet valve begins to close, the flow drops to 0 at 4.38 seconds, and the speed drops to 0 at 5.23 seconds. Thus, the three operating stages of the pump stop process are: from 2 to 4.38 seconds is the pump stop condition, from 4.38 to 5.23 seconds is the pump stop braking condition, and after 5.23 seconds is the pump stop turbine condition, with all parameters stabilizing within 22 seconds. Afterward, the system gradually stabilizes. During the pump stop condition, the pump flow and speed drop rapidly. The pump head (H) initially drops sharply, then oscillates slightly around zero. The impeller axial force, Fz, reaches its reverse maximum value of -20.83kN at 2.59 seconds. During the pump stop braking condition, the flow reverses, while the impeller speed remains positive but decreases. During the pump stop turbine condition, after 5.23 seconds, both the flow and speed are reversed. The reverse flow reaches a maximum value of -12.9 m³/s at 10.49 seconds, and the reverse speed reaches an extreme value of -327.56 r/min at 10.64 seconds.

Figure 4 Parameter changes during the pump stop process with different types of valves
When the pump outlet valve is a ball valve, the parameter change curve during the pump stop process is similar to that of the butterfly valve. In this case, the pump flow drops to zero at 4.40 seconds, and the speed drops to zero at 5.24 seconds. The changes in flow rate and speed before 15 seconds are nearly identical to those when the outlet valve is a butterfly valve. Between 15 and 22 seconds, the rate of flow reduction with the ball valve is slightly slower than with the butterfly valve, as the butterfly valve has a stronger cutoff effect during the later stage of valve closing.
When the pump outlet valve is a gate valve, the first half of the pump stop process differs slightly from the other two valve types, while the second half shows significant differences. In the first half of the pump stop process, the pump flow drops to zero at 4.37 seconds, and the speed drops to zero at 5.21 seconds, with values similar to those of the other valve types. The differences in the curves for water pump flow, speed, head, and blade axial force are primarily concentrated in the second half of the valve closing process. Between 10 and 22 seconds, the reverse extreme values of flow and speed are slightly higher than those of the butterfly valve and ball valve, while the rate of decrease in reverse flow and speed is significantly lower. It is evident that when the outlet valve is a gate valve, under the same valve closing control parameters, its flow capacity is the smallest among the three and significantly lower than the other two.
Table 1 shows the maximum values of reverse flow, reverse speed, and reverse axial force during the pump stop process with butterfly, ball, and gate valves as the outlet valves. The reverse extreme values with the butterfly and ball valves are similar, while the reverse extreme values with the gate valve are significantly different. Since the axial water thrust is minimal and stable at the moment of reverse extreme values, the reverse extreme values of axial water thrust for the three valves are only slightly different. The effect of gate valve configuration on the reverse extreme values is primarily reflected in flow rate and speed. The reverse flow rate and reverse speed increase with the gate valve. As shown in Figure 4, the time at which the reverse flow rate and speed reach their extreme values with the gate valve is significantly delayed compared to when the butterfly and ball valves are used.
Table 1 Reverse Extreme Values for Different Valve Types
| Valve Type |
Reverse Extreme Q (m³/s) |
Reverse Extreme n (r/min) |
Reverse Extreme Fz (kN) |
| Butterfly Valve |
-12.90 |
-327.56 |
-20.83 |
| Ball Valve |
-13.04 |
-327.92 |
-22.64 |
| Gate Valve |
-13.57 |
-341.13 |
-21.38 |
In summary, after stopping the pumps with three different types of outlet valves following the same linear closing law, the pump stop characteristics with the gate valve differ significantly from those with the other two valves. The differences in the reverse extreme values of the parameters are primarily observed in the flow rate and speed. Compared to the butterfly valve, the maximum reverse flow rate increases by 5.2%, and the maximum reverse speed rises by 4.1% when the gate valve is used.
During the pump stop process, rapid changes in flow rate and impeller speed cause frequent variations in the flow field, particularly in the impeller and valve areas. The effect of different valve types on flow field changes can be corroborated by the variations in external characteristic parameters. Initially, at 0 seconds, the impeller rotates clockwise. Figure 5 compares the impeller blade pressure distribution with different outlet valves during the pump stop process. The pressure distribution is shown at 13 seconds. The outer side of the blade represents the pressure surface, while the inner side represents the suction surface. At 13 seconds, the pumps in all operating conditions are in the pump stop turbine mode. The water flow reverses, and the reverse flow is substantial. The impeller's rotation direction changes to counterclockwise. The original blade outlet becomes the water inlet. The impact and flow separation caused by water entering the impeller area create partial high and low-pressure zones on the blade at 13 seconds, making it prone to negative pressure cavitation. When the outlet valve type differs, the variation in pressure distribution is similar to the differences in internal characteristic parameters. Specifically, the blade pressure distribution with butterfly and ball valves shows minimal variation, while the gate valve exhibits a greater difference. This is primarily reflected in a smaller low-pressure area on the blade's pressure surface and a larger high-pressure area on the suction surface, consistent with the observation that the head of the gate valve is larger at 13 seconds, as shown in Figure 4.
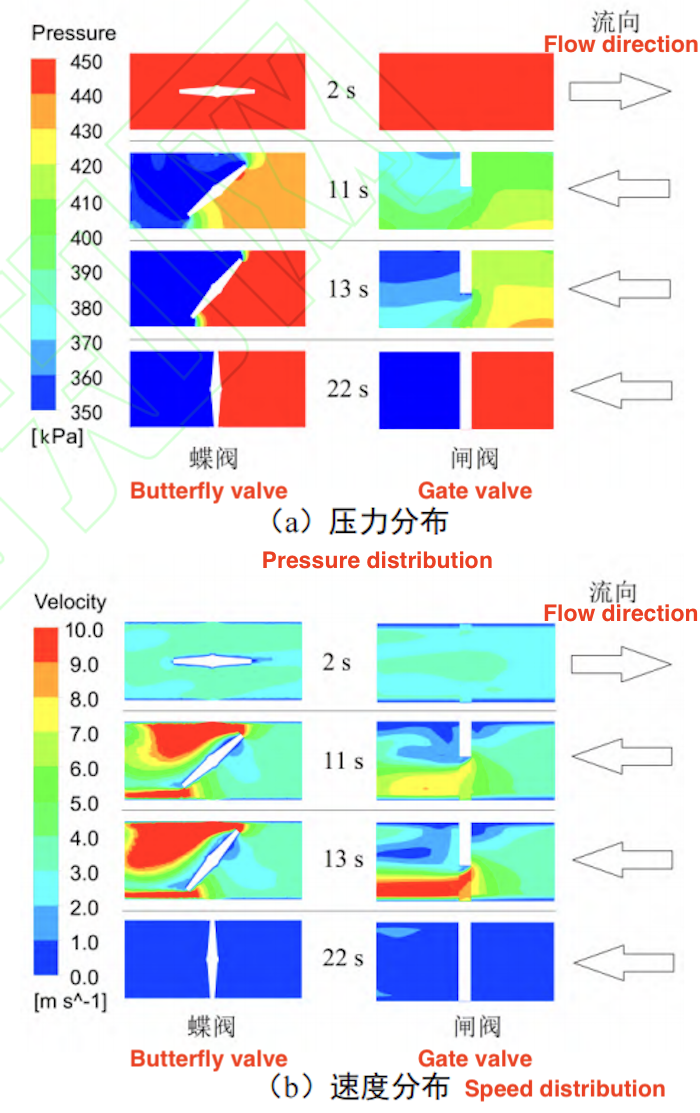
Figures 4 and 5 show that during the pump stop process, the change curves of the external characteristic parameters of the water pump and the blade pressure distribution differ slightly between the butterfly valve and the ball valve. Therefore, when analyzing the differences in the flow field of the valve area during the pump stop process with different valve types, only the butterfly valve and gate valve are selected for comparison, while the ball valve is omitted. Figure 6 presents a comparison of the pressure and speed changes in the valve area under the rated pump stop condition. According to the valve closing control law in Figure 2, the closing times for different valve types range from 2 to 22 seconds. The direction shown in the figure represents the flow of water under the rated operating conditions. During the pump stop process, the pressure on the water pump side (left side of the valve) shows a gradual decreasing trend, while the pressure on the pressure box side (right side of the valve) first decreases and then increases. Comparing the changes in pressure and speed distribution between the butterfly valve and gate valve, significant differences are observed: during the valve closing process, the pressure decrease rate on the water pump side of the butterfly valve is faster than that of the gate valve, and the pressure increase rate on the pressure box side of the butterfly valve is also faster. Comparing the effects of different valve types on flow velocity in the pipeline, it is observed that at 11 seconds, high-speed areas appear on both the upper and lower sides of the butterfly valve due to rapid flow channel contraction. In contrast, the high-speed area in the gate valve pipeline only appears at 13 seconds. Thus, under the same linear closing law, the change in the internal characteristic flow field shows that the butterfly valve has a stronger cutoff effect on the water flow, which is consistent with the parameter changes shown in Figure 4.

Figure 5 Pressure distribution on blades during shutdown

Figure 6 Variation of flow field for butterfly valves and ball valves


