Conventional hydraulic calculations are typically based on the static resistance characteristics of valves; however, differences between static and dynamic resistance during valve operation can result in calculation errors. Using a DN50 ball valve as a case study, this paper integrates an experimental water pipeline system with three-dimensional CFD analysis to investigate the static and dynamic resistance characteristics of the valve and their differences. The CFD model accounts for pipe-wall elasticity, water compressibility, and the density–pressure coupling associated with water hammer velocity, and its accuracy was validated through experiments. The results show that the valve’s static resistance coefficient increases exponentially with the closure rate. The dynamic resistance follows a similar trend with closure rate but is strongly affected by closure time: when the closure rate is below 81%, the dynamic resistance coefficient decreases as closure time increases, whereas above 81%, it increases. As closure time increases, the dynamic resistance gradually approaches the static resistance. The differences between static and dynamic resistance have a significant impact on water hammer pressure calculations. These findings offer valuable guidance for optimizing valve operation strategies and assessing hydraulic safety.
In water distribution systems—including municipal supply networks, long-distance transfer projects, and pumping stations—valves serve as essential control components. Their resistance characteristics directly influence system flow capacity and the reliability of water supply. Valve resistance is generally classified into static and dynamic types: static resistance represents energy loss under steady-state flow, whereas dynamic resistance refers to energy loss during valve actuation. Most hydraulic calculations rely solely on static resistance, neglecting dynamic effects. This oversight often results in inaccurate estimates of water hammer pressure and energy dissipation. Therefore, it is essential to investigate the differences between static and dynamic resistance.
Most existing studies have focused on the static resistance characteristics of valves, indicating that these characteristics are only marginally affected by the Reynolds number and the type of fluid. Three-dimensional CFD has been widely used to analyze valve dynamic flow fields and resistance characteristics. Previous studies have validated CFD’s accuracy in predicting transient pressures and have demonstrated the impact of valve closing time on dynamic resistance. However, a more comprehensive understanding of the relationship between static and dynamic resistance is still needed.
This study combines experimental testing with three-dimensional CFD analysis to investigate the static and dynamic resistance characteristics of valves and their impact on hydraulic calculations. A DN50 ball valve was chosen as the research subject, and an experimental pipeline system was constructed. The CFD model accounts for pipe-wall elasticity, water compressibility, and water hammer coupling, and its accuracy was validated against experimental results. By varying flow rates, pressures, and valve closing times, we systematically analyzed the trends in static and dynamic resistance and their effects on water hammer pressure, providing a valuable reference for valve operation strategies and hydraulic safety assessment in engineering applications.
The experiments were carried out on the long-distance hydraulic transient refinement platform at Hohai University. The experimental setup is illustrated in Figure 1. The platform comprises an upstream pressure tank, steel pipeline, electromagnetic flowmeter, pressure sensors, test ball valve, end valve, groundwater pump, and a water tank. The system has a total length of 241.52 m, with a pipe inner diameter of 0.05 m and a wall thickness of 0.0035 m. Pressure sensors were installed 0.22 m upstream and downstream, as well as 24.61 m upstream and 19.61 m downstream of the test ball valve. The sensor data were collected and stored using a data acquisition system.

Figure 1. Experimental setup diagram (unit: m)
For numerical simulation, the main section of the pipeline containing the test valve was extracted from the full system. The pipe length upstream of the valve inlet was 24.61 m, and the length downstream of the valve outlet was 19.61 m, with pressure sensors 1 and 4 serving as the upstream and downstream boundary conditions. After calibration, the water hammer wave propagation speed was determined to be 1320 m/s. The test valve was a DN50 manual quarter-turn ball valve, as shown in Figure 2.
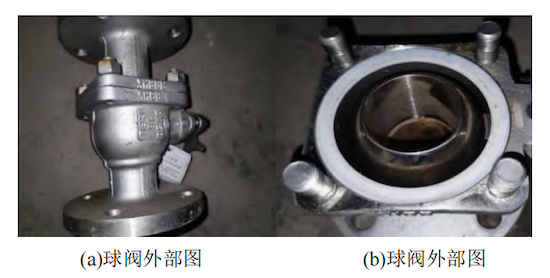
(a) External view of the ball valve (b) Cross-sectional view of the ball valve
Figure 2. Physical model of the DN50 ball valve
The objectives of the experiment were:
- To determine the local resistance coefficient of the DN50 ball valve at various openings under steady-state conditions.
- To measure the water hammer pressure at sensor 2 (located at the valve inlet) for specific valve closing times.
The experimental conditions for three flow rate groups are summarized in Table 1.
Table 1. Experimental conditions for ball valve static resistance characteristics
|
Case |
Closure Rate (%) |
Flow Rate (m³/h) |
Flow Rate (m/s) |
Reynolds Number (Re) |
Experimental Resistance Coefficient |
|
Working Condition |
57.80 |
2.50 |
0.35 |
17692 |
2.99 |
|
65.60 |
2.51 |
0.36 |
17763 |
142.22 |
|
|
70.00 |
2.50 |
0.35 |
17692 |
338.31 |
|
|
73.30 |
2.49 |
0.35 |
17622 |
801.94 |
|
|
76.70 |
2.51 |
0.36 |
17763 |
1773.75 |
|
|
Working Condition |
57.80 |
1.97 |
0.28 |
13941 |
51.39 |
|
65.60 |
2.01 |
0.28 |
14225 |
143.55 |
|
|
70.00 |
1.97 |
0.28 |
13941 |
340.10 |
|
|
73.30 |
2.01 |
0.28 |
14225 |
816.30 |
|
|
76.70 |
2.01 |
0.28 |
14225 |
1793.56 |
|
|
78.90 |
2.01 |
0.28 |
14225 |
5346.08 |
|
|
Working Condition |
57.80 |
1.52 |
0.22 |
10757 |
53.67 |
|
65.60 |
1.48 |
0.21 |
10474 |
140.74 |
|
|
70.00 |
1.51 |
0.21 |
10686 |
343.84 |
|
|
73.30 |
1.50 |
0.21 |
10615 |
839.80 |
|
|
76.70 |
1.51 |
0.21 |
10686 |
1795.45 |
|
|
78.90 |
1.51 |
0.21 |
10686 |
5343.97 |
Experimental Method for Static Resistance Characteristics of Ball Valves
The procedure for measuring the static resistance characteristics of the ball valve is as follows:
- Open the test ball valve and the end valve in the experimental system.
- Start the groundwater pump to circulate water, and allow the system to run for 20–30 minutes before collecting data to ensure that all air is expelled from the pipeline.
Increase the pressure in the upstream pressure tank to the design value specified in the test plan. Then, rotate the DN50 ball valve from fully open to the desired closure rate. When the valve is fully open, the closure angle is defined as 0°, and when fully closed, it is defined as 90°. The closure rate rr is defined as follows:
where θ is the current closure angle, and θmax=90∘. Thus, r=0%r = 0, when the valve is fully open, and r=100%, when it is fully closed.
Adjust the ball valve to the specified closure rate. For each closure rate, regulate the pipeline flow to the design value by adjusting the end valve. The specific operating conditions are listed in Table 1. Once the flow in the pipeline stabilizes, record and store the data from sensors 1, 2, 3, and 4 using the data acquisition system. These measuring points were selected to ensure that the pipeline flow field is fully developed for three-dimensional simulation.
The procedure for measuring the dynamic resistance characteristics is as follows:
- After completing the static resistance coefficient test, adjust the ball valve to the fully open position.
- Use the groundwater pump to raise the pressure in the upstream pressure tank to the design value specified in the test plan, and regulate the pipeline flow to the design flow rate. This ensures that the water hammer generated during valve closure does not damage the experimental system.
- Once the flow stabilizes, rapidly rotate the valve from fully open to fully closed, recording both the start and end times of valve closure. The data acquisition system simultaneously records and stores measurements from sensors 1, 2, 3, and 4.
The local resistance coefficient KKK of the valve is a dimensionless parameter that characterizes the head loss caused by flow through the valve. It is calculated using the following formula:
![]()
where:
Δh = head loss (m)
v = average flow velocity in the pipeline (m/s)
g = acceleration due to gravity (m/s²)
The governing equations of the three-dimensional CFD model are as follows:
Continuity equation:

Momentum equation:

where ∇2 is the Laplace operator; vx,vy,vz are the velocity components (m/s); τ is the stress tensor (N/m²); p is the pressure (Pa); ρ is the fluid density (kg/m³); and F is the external force (N).
The SST k–ω turbulence model was employed, offering improved accuracy in predicting transient pressures during the valve-closing process. The pressure–velocity coupling is solved using the SIMPLE algorithm (Semi-Implicit Method for Pressure-Linked Equations), and the computational domain is discretized using the finite volume method. A second-order scheme is applied to the pressure, density, and momentum equations, while the turbulent kinetic energy and specific dissipation rate are solved using the first-order upwind method. Time-stepping iterations use a first-order implicit scheme. In this 3D CFD model, both pipe wall elasticity and water compressibility are accounted for in the transient simulations. To stabilize pressure solutions for compressible fluids, a pressure correction equation is introduced, including an additional term related to wave velocity. Variations in fluid density account for the density–pressure coupling.
The pressure correction equation is expressed as follows:

where Ky is the effective bulk modulus of the liquid (Pa); Kw is the liquid bulk modulus (Pa); D is the pipe inner diameter (m); e is the pipe wall thickness (m); and E is the Young’s modulus of the pipe (Pa).
The wave velocity CCC of the water hammer inside the pipe is calculated as:

The mesh has a direct impact on the accuracy of numerical simulations. A structured mesh is employed for the computational domain in this 3D finite volume model. To more accurately capture the dynamic closing process of the ball valve, local mesh refinement was applied within the valve and in the regions immediately upstream and downstream. During the simulation, the ball valve was rotated by 66° using a dynamic mesh method, and the resistance coefficient at this angle was calculated. The 3D mesh model of the ball valve is shown in Figure 3.
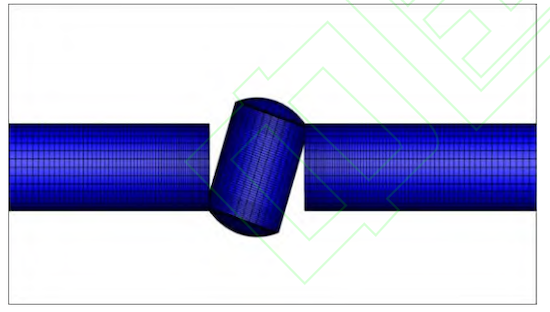
Figure 3. 3D Mesh Model of the Ball Valve
For the mesh independence analysis, three representative mesh sizes were selected, and the corresponding resistance coefficient values were calculated, as shown in Table 2. The results indicate that larger mesh sizes reduce numerical error but increase computational cost. Since further mesh refinement has a negligible impact on accuracy, the mesh with 440,448 elements was selected as the optimal balance between accuracy and computational efficiency.
Table 2. Mesh Independence Analysis
|
Serial Number |
Computational Domain Elements |
Numerical Simulation Resistance Coefficient |
Experimental Resistance Coefficient |
Relative Error |
|
1 |
118,116 |
779.809 |
839.802 |
7.144% |
|
2 |
440,448 |
831.368 |
839.802 |
1.004% |
|
3 |
825,840 |
831.221 |
839.802 |
1.002% |
Based on the experiments, numerical simulations were performed using 3D CFD under identical conditions. In the static simulations of the ball valve, the valve closure rate was adjusted using the dynamic mesh method to match the experimental values. The inlet boundary condition was defined as a velocity inlet, and the outlet boundary condition was set as a pressure outlet. The resistance coefficients obtained from the steady-state experiments and numerical simulations are presented in Figure 4.

Figure 4. Comparison of Steady-State Experiments and Numerical Simulations
As shown in Figure 4 and Table 1, the static resistance coefficients of the ball valve under the three flow conditions are essentially consistent. The coefficients obtained from numerical simulations agree closely with the experimental results, with a minimum relative error of 1.004%. In the transient numerical simulations, the experimental valve-closing time of 0.666 s was applied. The pressure recorded by sensor 2 was compared with the water hammer pressure measured 0.22 m upstream of the valve during the simulation. The valve closing time in the simulation was also set to 0.666 s using the dynamic mesh method. For the computational domain, the inlet boundary was defined as a profile-variable pressure inlet, with values matching those recorded by sensor 1 in the experiment. Similarly, the outlet boundary was defined as a profile-variable pressure outlet, with values matching those recorded by sensor 4 in the experiment. The specific calculation results are presented in Figure 5. The water hammer pressures obtained from the numerical simulations closely agree with the experimental measurements.

Figure 5. Comparison of Transient Experiment and Numerical Simulation
Based on comparisons between the static and dynamic valve-closing experiments and the numerical simulations, it is evident that the 3D CFD model achieves high accuracy in both steady-state and transient analyses of the ball valve.
Based on experimental validation of the numerical simulations, this section employs dynamic mesh technology to analyze the static resistance coefficient of the ball valve at various closure rates. The valve was closed from fully open (0% closure) to 3.3%, 5.5%, 11.1%, 22.2%, 33.3%, 44.4%, 55.5%, 66.7%, 72.2%, 75.6%, 77.8%, 78.9%, 80%, 81.1%, 82.2%, 83.3%, and 84.4%. After the flow reaches a steady state, the resistance coefficient for each closure rate is determined. The results are presented in Figure 6.
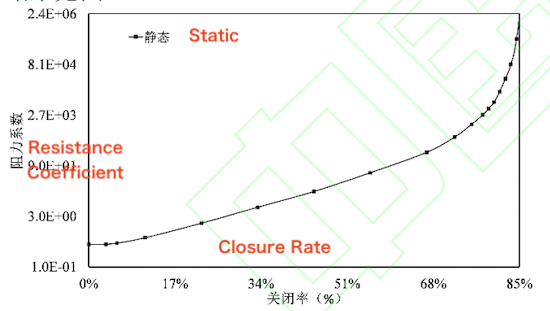
Figure 6. Static Resistance Coefficient Curves at Different Closure Rates
As shown in Figure 6, the static resistance coefficient of the ball valve increases exponentially with the closure rate. When the closure rate is below 66.7%, the resistance coefficient rises only slightly. At this stage, the increased closure rate has little effect on pipeline flow, as water inertia dominates, causing the flow rate to decrease gradually. Consequently, the resistance coefficient rises slowly. However, when the closure rate exceeds 66.7%, the resistance coefficient increases sharply with further closure. In this range, valve resistance becomes dominant, causing the pipeline flow rate to drop rapidly and the resistance coefficient to increase steeply.
After verifying the accuracy of the transient numerical simulation using the aforementioned valve-closing experimental data, the boundary conditions at both ends were fixed, and dynamic mesh technology was applied.
Numerical simulations were then conducted for different closure times (0.009 s, 0.015 s, 0.045 s, and 0.09 s). The results are shown in Figure 7.
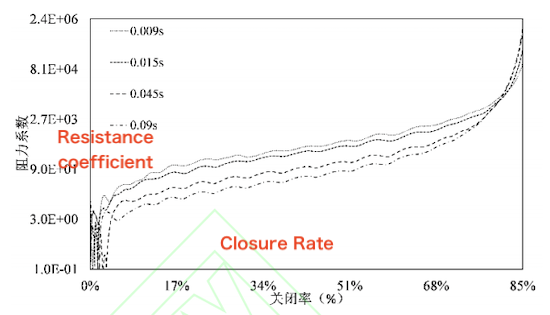
Figure 7. Dynamic Resistance Coefficient Curves for Different Closure Times
As shown in Figure 7, for a given closure time, the dynamic resistance curve exhibits an exponential growth trend similar to that of the static resistance curve. Moreover, the valve’s dynamic resistance characteristics are significantly influenced by the closure time. At a given closure rate, the dynamic resistance coefficient is initially negatively correlated with closure time, followed by a positive correlation in the second stage. Specifically, the dynamic resistance process can be divided into two stages:
Stage 1 (0–81.0% closure rate): At a given closure rate, the longer the closure time, the smaller the ball valve’s resistance coefficient.
Stage 2 (above 81.0% closure rate): At a given closure rate, the longer the closure time, the larger the resistance coefficient.
This behavior can be explained by the pressure difference distribution across the valve (Figure 8) and the flow velocity distribution in the pipeline (Figure 9). In the first stage, during short valve closing times, the flow velocity (vvv) decreases more rapidly, while the pressure difference (Δh\Delta hΔh) rises more quickly. According to Equation (1), the corresponding resistance coefficient therefore increases more rapidly, meaning that shorter closure times result in higher resistance coefficients than longer closure times.
According to Equation (1), the corresponding resistance coefficient therefore increases more rapidly, meaning that shorter closure times result in higher resistance coefficients than longer closure times. As a result, the resistance coefficient increases more slowly, so shorter closure times correspond to lower resistance coefficients than longer closure times.
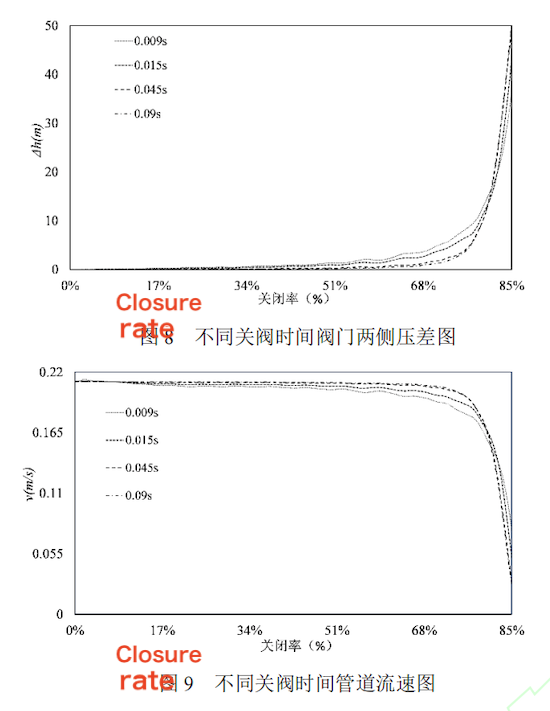
Figure 8. Pressure Difference Across the Valve at Different Closing Times
Figure 9. Pipeline Flow Velocity at Different Closing Times
The results above describe the static and dynamic resistance characteristics of ball valves separately. A comparison highlights the differences between static and dynamic resistance. As shown in Figure 10, the steady-state condition can be considered as the limiting case where the valve closing time approaches infinity. During the dynamic closing process, as the closure time increases, the dynamic resistance coefficient curve gradually approaches the static resistance coefficient curve. This indicates that, although static and dynamic resistance characteristics are closely related, they also exhibit clear distinctions.
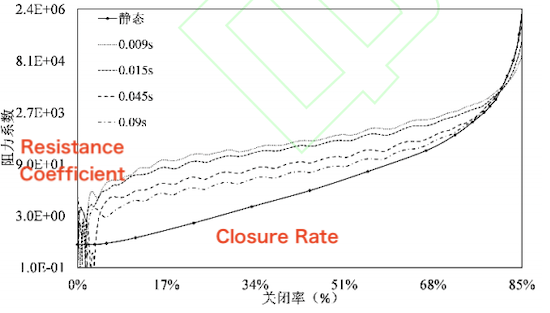
Figure 10. Comparison of Static and Dynamic Resistance Coefficient Curves
To quantify the differences between the static and dynamic resistance characteristics of ball valves, a typical case was designed using the one-dimensional characteristic line method:
The system consists of a reservoir–pipeline–valve–pipeline–reservoir configuration. The test valve is a DN50 ball valve. The pipelines on both sides of the valve are 10 m long, with an inner diameter of 0.05 m and a wall thickness of 0.0035 m. The upstream reservoir pressure boundary is 39.85 m, and the downstream reservoir pressure boundary is 39.80 m.
After the pipeline flow reached a steady state, the static resistance coefficient of the ball valve and the dynamic resistance coefficient for a closure time of 0.045 seconds (Figure 10) were input into the simulation. The closure time was set to 0.045 seconds, and the pressure curve upstream of the valve was obtained, as shown in Figure 11.
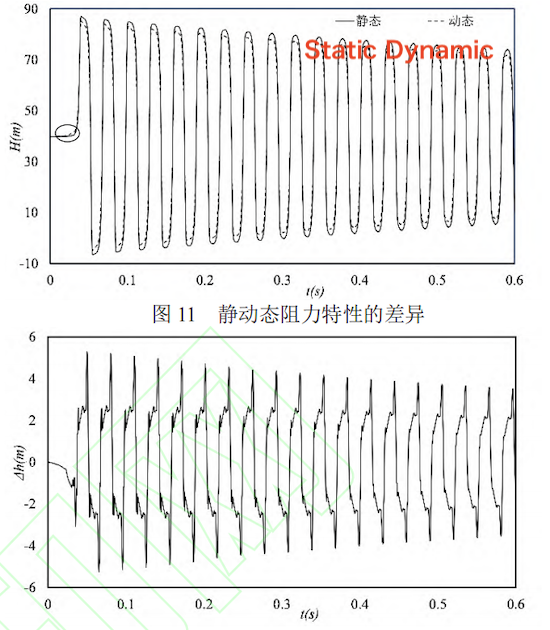
Figure 11. Differences in Static and Dynamic Resistance Characteristics
Figure 12. Quantification of Differences Between Static and Dynamic Resistance Characteristics
As shown in Figure 11, the static and dynamic resistance characteristics of the valve differ during hydraulic transient calculations. Figure 12 illustrates the pressure differences upstream of the valve over time under the two conditions shown in Figure 11. The results indicate that the static and dynamic resistance characteristics of the valve differ significantly in practical hydraulic calculations. When the valve transitions from fully open to fully closed, the water hammer response under dynamic closure is faster (circled in Figure 11), and the water hammer pressure amplitude is generally lower than that observed under static closure. Because a larger resistance coefficient reduces the flow through the valve more and increases the water hammer amplitude, the fluctuation values differ between static and dynamic resistance conditions during the valve’s full closing process.
The accuracy of valve resistance characteristics is critical for precise control of system flow and ensuring hydraulic safety. Using a DN50 ball valve as a case study, this research investigated the static and dynamic resistance characteristics and their differences through an experimental pipeline system combined with three-dimensional CFD analysis. The main conclusions are as follows:
- The CFD model considers pipe wall elasticity and water compressibility, incorporating a density–pressure coupling associated with the water hammer wave velocity. Experimental validation demonstrates that the numerical simulation can accurately predict both static and dynamic resistance coefficients. Under static conditions, the relative error is approximately 1.004%, while in dynamic valve-closing conditions, the simulated water hammer pressure closely matches the experimental measurements.
- The static resistance of the ball valve increases exponentially with closure rate: it grows gradually when the closure rate is below 66.7% and rises sharply when above 66.7%.
- The dynamic resistance shows a trend similar to that of the static resistance but is strongly influenced by closure time: when the closure rate is below 81%, the dynamic resistance decreases as closure time increases, whereas when the closure rate is above 81%, it increases with longer closure times.
- The static resistance can be considered the extreme slow-closing limit of the dynamic resistance. During dynamic closure, the dynamic resistance coefficient gradually approaches the static resistance curve as the closure time increases.
- Differences between static and dynamic resistance characteristics influence the accuracy of water hammer pressure calculations during hydraulic transients.