Abstract: This study addresses the limitations of traditional valve stem packing and clearance designs under high-pressure conditions by investigating the sealing performance of graphite packing in high-pressure hydrogen ball valves. By analyzing the internal flow field and sealing structure based on the valve’s mechanical characteristics, this study evaluates the effects of packing height, compression rate, friction coefficient, and clearance on sealing performance. Results show that the maximum flow velocity during valve closure occurs at the valve core outlet, reaching 32.4 m/s. The pressure fluctuation at the fluid-solid interface of the packing ring is 13,700 Pa, while flow velocity ranges from 0 to 4 m/s, indicating a minimal effect on sealing performance. However, the compression rate and clearance have a significant impact on sealing effectiveness. While a higher friction coefficient increases contact pressure, it also leads to greater wear. The optimal packing configuration was identified as a total height of 20 mm, a clearance of 0.1 mm, a compression rate of 22%, and a friction coefficient of 0.1. A sealing performance test conducted at 45 MPa and room temperature showed no leakage, confirming the design’s reliability. These results provide valuable guidance for designing effective sealing structures in high-pressure ball valves.
With the rapid development of hydrogen and clean energy technologies, the number of hydrogen fuel cell vehicles is steadily rising, driving accelerated growth in the construction of hydrogen refueling stations. However, China still faces challenges in core technologies, high-pressure equipment, and industrialization, resulting in high construction costs and heavy reliance on imported key components. As a crucial component in the 35 MPa hydrogen refueling station system, the sealing performance of high-pressure shut-off ball valves is vital; however, existing sealing structures lack stability, and their design theory needs further advancement. Flexible graphite has become an ideal material for dynamic sealing applications thanks to its excellent resilience, high-temperature resistance, and low friction properties. Several researchers have investigated the sealing performance of graphite rings. For example, Li Xinggen et al. studied leakage and wear through low-pressure reciprocating motion tests, finding that V-shaped cross-sections outperform flat rings and recommending a density of 1.5 g/cm³. Peng Chuantao et al. discovered that alternating combination structures provide better sealing performance and lower friction. Chen Fengguan et al. enhanced their testing apparatus to accurately control preload and measure leakage. However, most of these studies focus on low-pressure conditions and lack quantitative analysis of packing structure performance under high-pressure environments. In simulation studies, Zhao et al. performed finite element analysis on flexible graphite composite structures at 50 MPa but overlooked pressure penetration risks, which may compromise the self-sealing performance. Lu Zhaijun et al. investigated the sealing behavior of PTFE sealing rings at 30 MPa and validated their reliability through penetration simulations. However, the current design guidelines for valve stem sealing under high-pressure conditions are still inadequate, often neglecting the impact of dynamic flow field variations on sealing performance. To address these gaps, this study first employs Fluent to analyze the flow characteristics at the fluid-solid interface during the ball valve’s transition from fully open to closed, aiming to eliminate the effects of pressure fluctuations. Based on the mechanical properties, a two-dimensional axisymmetric model of the graphite packing is established, using the BISO model to accurately simulate the material behavior. The finite element method is applied to study the impact of packing height, compression rate, friction coefficient, and fit clearance on sealing performance, leading to the identification of the optimal parameter combination. Finally, a high-pressure sealing test is performed to validate the structural reliability, providing both theoretical insights and experimental confirmation for the design of high-pressure ball valve sealing systems.
The high-pressure hydrogen ball valve is designed for extreme pressure environments, featuring a compact structure, thick valve walls, and a small overall volume. All metallic components are made of corrosion-resistant 316L stainless steel. Figure 1 illustrates a typical valve structure, which includes a graphite packing sealing ring (packing ring), valve stem, valve body, packing gland, valve core, and valve seat sealing ring. The packing ring, typically square or V-shaped, is arranged in multiple layers between the valve stem and valve body. Axial compression from the packing gland preload generates contact pressure on the sealing surfaces, preventing internal gas leakage. This contact pressure effectively prevents hydrogen gas from leaking through gaps in the high-pressure ball valve. The three main sealing surfaces—inner, lower, and outer—are shown in Figure 1.
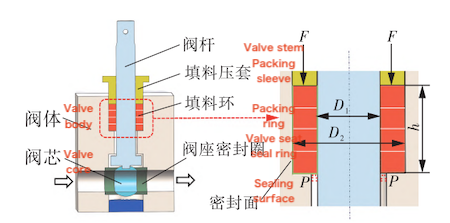
Figure 1. Schematic Diagram of High-Pressure Hydrogen Ball Valve Structure
The valve body dimensions are 50 mm × 50 mm × 60 mm, with the stuffing box accommodating the packing ring featuring an inner diameter (D₁) of 10 mm and an outer diameter (D) of 18 mm. Square packing rings are selected, each measuring 4 mm in width and height to fit the 4 mm stuffing box. In hydrogen refueling stations designed for 35 MPa, the valve must endure a maximum working pressure of 45 MPa, with hydrogen (H₂) as the operating medium.
Key structural parameters examined in this study include packing height (h) and sidewall clearances (e₁ and e₂), where e₁ is the clearance between the packing ring and the valve stem, and e₂ is the clearance between the packing ring and the valve body; together, they define the effective cross-sectional dimensions of the packing ring. Preload force (F) and hydrogen pressure (P) are critical parameters that significantly influence the sealing performance and reliability of the valve under high-pressure hydrogen conditions.
To ensure fully developed turbulence at the valve inlet, a 100 mm long straight pipe is added to both the inlet and outlet sections. A 0.1 mm clearance between the valve stem and valve body allows the working fluid to reach the fluid-solid interface. Due to the tight seal between the valve core and valve seat, fluid flow behavior varies with the rotation angle of the valve core. When the valve core rotates from 0° to 18°, the fluid flows solely through the valve core channel; between 18° and 87°, the flow expands into the valve cavity. The critical transition angle from open to closed is 87°, with the valve fully closed at 90°. Fluent Meshing is employed to create the computational mesh from the full-size fluid domain derived from the solid model, using a non-structured block mesh for the fluid region. Figure 2 shows the fluid domain and fluid-solid interface, while Figure 3 presents the block-structured mesh of the ball valve’s fluid domain, divided into four main zones. The rotating fluid domain is defined as the volume of an equal-diameter sphere representing the valve core’s rotation, with the valve core volume subtracted. Mesh refinement is applied to the valve core channel and valve cavity fluid domains to enhance simulation accuracy. Additionally, contact connections using the binding method are established between relevant fluid domains to simulate fluid entry into the valve cavity during rotation. After confirming grid independence, steady-state numerical simulations are conducted to analyze flow characteristics and sealing performance.
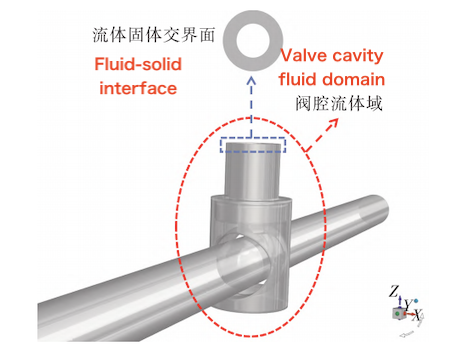
Figure 2 The full-size fluid domain and fluid-solid interface
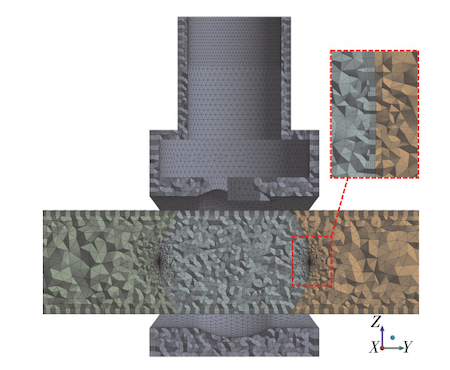
Figure 3 The block-structured fluid domain and mesh segmentation
ANSYS Fluent is employed to simulate the internal flow field of the high-pressure hydrogen ball valve using transient numerical analysis based on a single-phase flow model and the sliding mesh technique. The working medium is modeled as an incompressible fluid, with a reference pressure set at 45 MPa and the pipeline inlet designated as the reference location. The inlet and outlet boundaries are both set as pressure inlets, with an initial transient simulation velocity of 20 m/s representing the fully open flow condition. The inlet gauge pressure is set at 6750 Pa, the outlet pressure at 0 Pa, and the turbulence intensity is specified as 5%. Based on the turbulent flow characteristics within the ball valve, the RNG k-ε turbulence model is employed, as it effectively satisfies the Reynolds number criteria. The turbulent kinetic energy equation is expressed as follows:
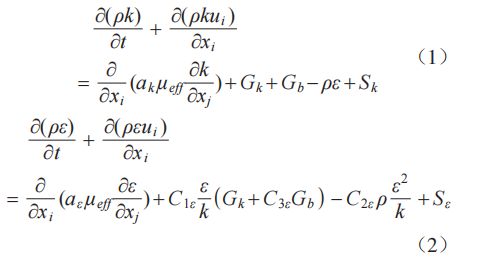
- ρ is the fluid density
- k is the turbulent kinetic energy
- t is time
- u is the flow velocity
- Cμ and σk are empirical constants
- μ_eff = μ + μ_t represents the effective viscosity
- μ is the dynamic viscosity
- G_k is the turbulent kinetic energy generated by the velocity gradient
- G_b is the turbulent kinetic energy generated by buoyancy
- ε is the turbulent dissipation rate
- S_k and S_ε are source terms
Based on actual valve operation, the closing process involves a 90° rotation completed in 1 second, resulting in a rotational speed (n) of 0.25 revolutions per second (r/s). The corresponding angular velocity (ω) is calculated as:
The angular velocity is calculated as ω = 2πn ≈ 1.57 rad/s.
In Fluent, the rotating fluid domain is set with grid motion, using the Z-axis as the axis of rotation and an angular velocity of 1.57 rad/s. The solution employs a coupled pressure–velocity solver, using the second-order upwind discretization scheme for momentum, turbulent kinetic energy (k), and dissipation rate (ε) to ensure accurate and stable numerical results.
The hydrogen flow within the pipeline and ball valve is characterized by low velocity under high pressure and a small pressure difference. Figure 4 shows the velocity distribution at different stages of the valve closing process. As the valve starts to close, the inlet flow area decreases, leading to an initial rise in velocity. However, as the inlet pressure remains constant, the velocity gradually decreases as the valve opening narrows. The peak flow velocity occurs at the valve core channel outlet when the valve core rotates to 22.5°, reaching 32.4 m/s. As the valve closes further, the maximum velocity decreases to 28.3 m/s at 40.5° and to 14.6 m/s at 70.5°. When the valve is fully closed, the velocity drops to zero, confirming that the peak velocity occurs near the valve core channel outlet at approximately 22.5°, rather than near the fully closed position.
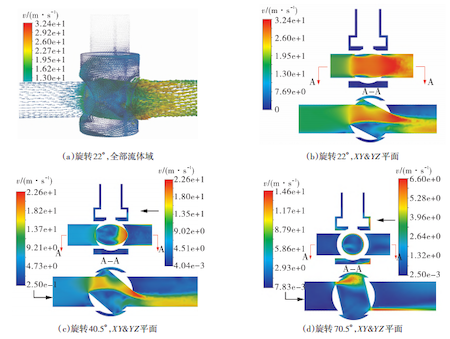
Figure 4. Flow velocity distribution at various valve rotation angles
(a) 22° rotation, full fluid domain (b) 22° rotation, XY and YZ planes (c) 40.5° rotation, XY and YZ planes
(d) 70.5° rotation, XY and YZ planes
To evaluate sealing performance, instantaneous pressure and velocity data (excluding boundary effects) were extracted from the fluid–solid interface during valve core rotation angles ranging from 18° to 87°, as illustrated in Figure 5. In Figure 5(a), the interface pressure initially decreases, gradually rises, and then drops again just before the valve reaches full closure. Figure 5(b) shows that the interface flow velocity remains low throughout the closing process, ranging from 0 to 4 m/s, with a peak of 3.51 m/s occurring between 30° and 40°. Due to the flow time lag at different locations, this peak velocity does not align with the overall maximum velocity. Figure 5(c) presents the pressure contour at a rotation angle of 65°, revealing a pressure gradient across the interface that drives medium flow within the interface plane. Overall, the closing process produces a pressure difference of approximately 13,700 Pa at the fluid–solid interface, which is negligible compared to the system’s operating pressure of 45 MPa.

Figure 5. Flow Characteristics at the Fluid–Solid Interface During Valve Rotation
(a) Maximum interface pressure during rotation (b) Maximum interface flow velocity (c) Pressure distribution at 65° rotation
An axisymmetric finite element analysis (FEA) model is constructed using the Ansys Static Structural module to evaluate the sealing behavior. The numerical model and corresponding mesh are shown in Figure 6. The sealing structure consists of key components including the valve stem, valve body, and packing ring. Based on the mechanical properties of the flexible graphite material, the packing ring’s constitutive behavior is defined using a bilinear isotropic hardening model in the finite element simulation.
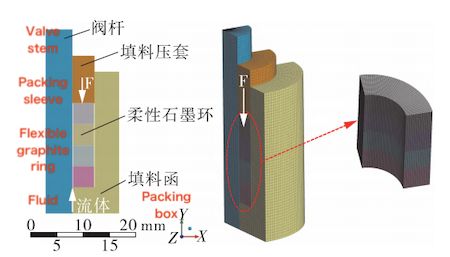
Figure 6. Numerical model and mesh
MATHAN et al. defined a Poisson’s ratio of 0.30 and a yield strength of 1 MPa in their constitutive model for graphite wound sealing rings. These parameters were experimentally validated and found to accurately represent the material's mechanical behavior.
Qiangqiang Wang investigated flexible graphite metal wound gaskets, using a Poisson’s ratio of 0.01 and a yield strength of 1 MPa to describe the material’s compression and rebound characteristics. Therefore, a 1 MPa yield strength error in simulations is considered negligible for flexible graphite materials. Wang Xiao and others compared experimental data with different Poisson’s ratios and elastic modulus formulas, concluding that a Poisson’s ratio of 0.3 minimized simulation errors, and the elastic modulus calculated using empirical engineering formulas closely matched experimental results. Using a similar modeling approach, the relevant material parameters calculated with engineering empirical formulas are summarized in Table 1.
Table 1. Material parameters of flexible graphite ring
|
Parameter |
Value |
|
Elastic Modulus (MPa) |
252.186 |
|
Poisson’s Ratio |
0.300 |
|
Tangent Modulus (MPa) |
96.995 |
|
Initial Yield Strength (MPa) |
1 |
In the Ansys Static Structural simulation, the following contact pairs are defined to accurately model the mechanical interaction within the valve assembly:
- Contact between the packing ring and the valve stem
- Contact between the packing ring and the valve body
- Contact between the packing ring and the packing gland
- Contact between the packing gland and the valve stem
- Contact between the packing gland and the valve body
These contact definitions are critical for simulating realistic stress distribution and deformation behavior under operating conditions.
Contacts (1) to (3) are set as frictional with a coefficient of 0.1, with the packing ring surface acting as the contact surface and the mating structural surfaces as target surfaces. Contacts (4) and (5) are defined as frictionless. Large deformation is enabled, and nonlinear analysis is performed using energy-based constant stiffness control for solution stability. The simulation includes both the initial compression of the sealing structure and the rotational motion of the valve stem. The displacement of the packing gland is constrained to zero in the X direction, and its rotation about the Z-axis is also fixed. Three load steps are applied:
Step 1: A small displacement ranging from 0 to 0.001 mm is applied to the lower face of the packing gland to avoid penetration between the contact and target surfaces due to excessive initial compression, which could otherwise cause numerical errors during the simulation.
Step 2: The displacement of the packing gland is then increased from 0.001 mm to the target value corresponding to the specified compression rate.
Step 3: The valve stem rotates relative to the packing ring at an angular velocity of 1.57 rad/s.
Additionally, to simulate medium pressure penetration, an extra analysis step is introduced. The pressure is applied at the fluid-solid interface node located near the valve stem on the lower side of the packing, as illustrated in Figure 2. The APDL command “SFE” is used to adjust the loading area on the contact elements according to the contact status, thereby enabling the application of medium pressure.