Abstract: The development of safe and reliable LNG cryogenic valves under extreme operating conditions requires multidisciplinary analysis and design optimization. In cryogenic environments, issues such as low-temperature material embrittlement, seal failure, and structural deformation can readily lead to valve leakage or malfunction. To address the limitations of traditional cryogenic valve design, including disciplinary fragmentation, overly simplified assumptions, and inadequate verification methods, this study takes a DN15 cryogenic globe valve as a case study. A multidisciplinary analysis covering thermodynamics, fluid mechanics, and structural statics is conducted, and a corresponding design optimization method is proposed. Through optimization analysis, the optimal configuration is identified as a 28 mm distance between the bottom of the valve disc and the positioning nut and a disc tilt angle of 20°. The optimized design achieves a 15% reduction in overall weight, providing an effective approach for optimizing conventional cryogenic valve designs.
In recent years, with the rapid expansion of global LNG production capacity, international LNG maritime trade has entered a period of rapid growth. This development has created an urgent need for in-depth mechanistic studies of LNG cryogenic valves, as well as technological upgrades and comprehensive product-line development. The objective is to bring the technical performance of LNG cryogenic valves in line with that of internationally recognized brands, strengthen China's technological capabilities in this field, and provide solid technical support for enhancing the technological independence, self-reliance, and localization of China's high-end valve industry.
LNG cryogenic valves perform critical functions in these systems, including shut-off, non-return, and flow regulation. They are primarily used for cryogenic service at temperatures around −163°C. Under such extreme operating conditions, the structural design of LNG cryogenic valves must not only comply with general valve design principles but also ensure safe and reliable operation, leak-tight sealing, and smooth and responsive opening and closing.
The multidisciplinary analysis and design optimization of LNG cryogenic valves is essential for ensuring safe and reliable operation under extreme conditions. In cryogenic environments, issues such as low-temperature material embrittlement, seal failure, and structural deformation can readily lead to valve leakage or malfunction. To address these challenges, LNG cryogenic valves incorporate key technologies, including low-temperature embrittlement-resistant materials such as austenitic stainless steel, extended bonnets for thermal isolation, multiple dynamic seal compensation structures, and cavity designs that prevent liquid retention, thereby ensuring leak-tight and stable operation under extreme temperature conditions.
Traditional cryogenic valve designs have significant limitations under extreme cryogenic operating conditions, largely due to disciplinary fragmentation, oversimplified assumptions, and inadequate validation methods. Thermodynamic analyses frequently overlook dynamic phase changes, such as flashing, and real-time fluid–structure coupling. Fluid dynamics studies often treat the medium as single-phase flow, failing to capture the nonlinear characteristics of gas–liquid two-phase flow. Structural analyses, meanwhile, often rely on material properties measured at ambient temperatures without fully accounting for changes in material behavior under cryogenic conditions. Consequently, issues such as seal failure, stem fracture, and control instability can occur. Fundamentally, these limitations stem from the lack of multidisciplinary analysis, making it difficult to meet the core requirements of safety, reliability, and efficiency in cryogenic service.
This study focuses on a DN15 cryogenic globe valve and proposes a multidisciplinary design optimization method that integrates thermodynamics, fluid dynamics, and structural mechanics through collaborative analysis and active design optimization. The proposed approach addresses the limitations of traditional cryogenic valve design and provides a systematic basis for the development and optimization of cryogenic valves.
This study examines a DN15 cryogenic globe valve designed for an operating pressure of 5 MPa, with a pressure drop of 0.1 MPa between the inlet and outlet. The working medium is liquefied natural gas (LNG) at −163°C. Liquid nitrogen at −196°C is used as the test medium for sealing performance and strength tests. The test pressures are 5.5 MPa for the leakage test and 7.5 MPa for the strength test.
As LNG flows through the valve, a portion of the liquid undergoes endothermic vaporization. To accurately simulate the actual operating conditions, the phase behavior of the fluid inside the LNG valve must first be analyzed. Because the valve body remains at cryogenic temperatures during operation and the valve design minimizes heat ingress, the valve body is assumed to be adiabatic, with no heat transfer, and completely filled with LNG in the simulation. Accordingly, the fluid domain model can be simplified to focus on the phase-change behavior of the medium in the valve neck.
As shown in the fluid domain model in Figure 1, the pressure distribution is essentially uniform. LNG is used as the working fluid in the model. The boundary conditions include convective heat transfer at the double-wall surfaces, with a heat transfer coefficient of 20 W/(m²·°C) and an ambient temperature of 22°C, and an adiabatic wall condition at the mid-height plane. The inlet pressure is set to 5 MPa, and the inlet temperature is set to −163°C.
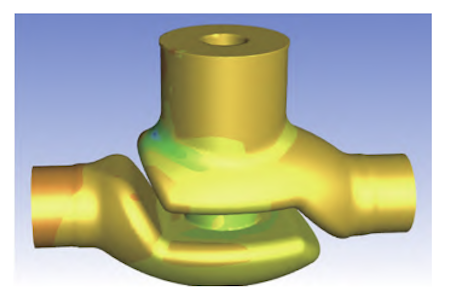
Figure 1. Fluid domain model
Figure 2 illustrates the phase-change process during the first 6 s of liquid filling. Initially, the pressure in the valve neck cavity is lower than the inlet pressure of the liquid. As the working fluid flows into the cavity, the liquid level rises. Due to convective heat transfer between the cavity wall and the surroundings, the LNG absorbs heat, undergoes subcooled boiling, and eventually undergoes a phase transition. Because the liquid-to-gas volume ratio is approximately 1:625, the phase transition generates a large volume of gas, resulting in a rapid increase in cavity pressure. The increasing pressure drives the liquid out of the cavity until only a small amount of liquid remains, at which point a dynamic pressure balance is established between the cavity interior and the external environment.
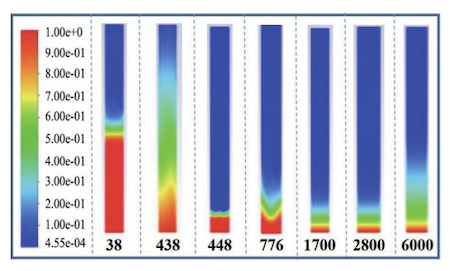
Figure 2. Schematic of the phase-change process
Figure 3 presents the temperature variations during the phase-change process. As LNG flows into the valve, the temperature inside the long-neck bonnet cavity drops rapidly. The cryogenic LNG absorbs heat and undergoes intense phase change, resulting in significant temperature fluctuations. Once the liquid is completely expelled, however, the gas inside the cavity reaches a relatively stable state. Continuous convective heat transfer through the cavity walls eventually establishes a stable temperature gradient, with lower temperatures near the cryogenic insulation layer.
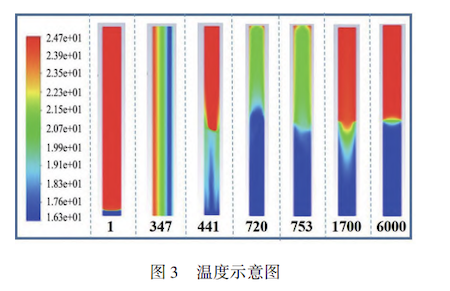
Figure 3. Temperature variations during the phase-change process
The flow-rate variations shown in Figure 4 further support these conclusions. During the initial stage, a large amount of working fluid enters the cavity. Subsequently, intense vaporization caused by subcooled boiling leads to pronounced fluctuations in the liquid level. After 6 s, the flow rate gradually stabilizes and eventually approaches zero. This indicates that the liquid in the cavity has been almost completely expelled. Only a small amount of liquid subsequently enters the cavity, where it absorbs heat and vaporizes, thereby maintaining a dynamic thermal equilibrium. In summary, during stable operation of the globe valve, the valve neck is primarily filled with natural gas vapor, with virtually no liquid accumulation.
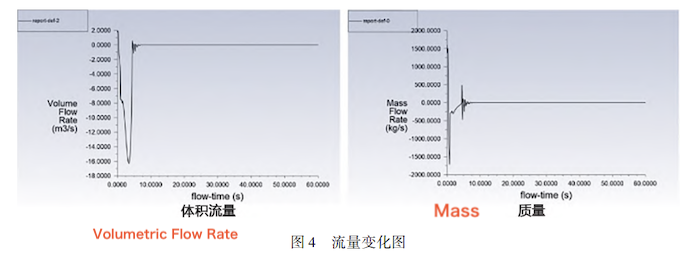
Figure 4. Flow-rate variations during the phase-change process
The internal temperature field of the cryogenic valve is mapped onto the structural analysis model. The valve material is CF3M austenitic stainless steel, and its thermal conductivity and average coefficient of linear thermal expansion are listed in Table 1.
Table 1. Thermal Conductivity and Average Coefficient of Linear Thermal Expansion of CF3M Austenitic Stainless Steel
Test Item | C-Solid | C1-12 |
Thermal conductivity at 77 K / [W/(m·K)] | 7.53 | 6.90 |
Average coefficient of linear thermal expansion (77–290 K) / (10⁻⁶/K) | 14.31 | 14.01 |
An insulation layer is provided on the outer surface of the valve body, extending from the valve body to the upper surface of the bonnet flange, and is designed for cryogenic service at −163°C. Natural convection occurs between the outer surface of the insulation layer and the ambient air, with a heat transfer coefficient of 20 W/(m²·°C) and an ambient temperature of 22°C. Figure 5 shows the overall temperature distribution of the valve.
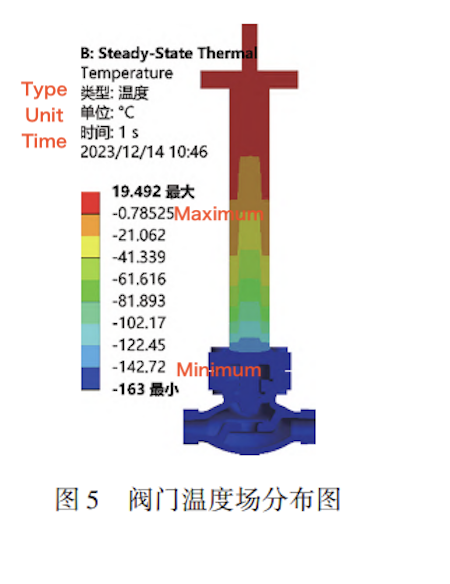
Figure 5. Temperature field of the valve
(2) Figure 6 shows the effects of insulation layer height and ambient temperature on the valve temperature. To investigate the temperature distribution at the bottom of the stuffing box of the DN15 cryogenic valve under different insulation layer heights, a temperature field analysis is conducted. The analysis considers ambient temperatures of 8°C, 10°C, 15°C, and 20°C and insulation layer heights (d) of 0 mm, 25 mm, 50 mm, 75 mm, and 100 mm. The valve model is equipped with a drip tray, which must be kept at a sufficient distance from the insulation layer. Therefore, the maximum insulation layer height is limited to half the height of the drip tray.
Figure 7(a) shows how the temperature at the bottom of the stuffing box varies with insulation layer height and ambient temperature. The temperature decreases as the insulation layer height increases, whereas, at a fixed insulation layer height, it increases with increasing ambient temperature.
As shown in Figure 7(b), the temperature at the bottom of the stuffing box of the cryogenic valve gradually increases from the inner side to the outer side, with the lowest temperature, and therefore the highest risk of icing, occurring near the valve stem. In addition, the minimum temperature at the bottom of the stuffing box decreases with increasing insulation layer height and increases with increasing ambient temperature. Therefore, the insulation layer height should be selected according to the valve's operating environment.
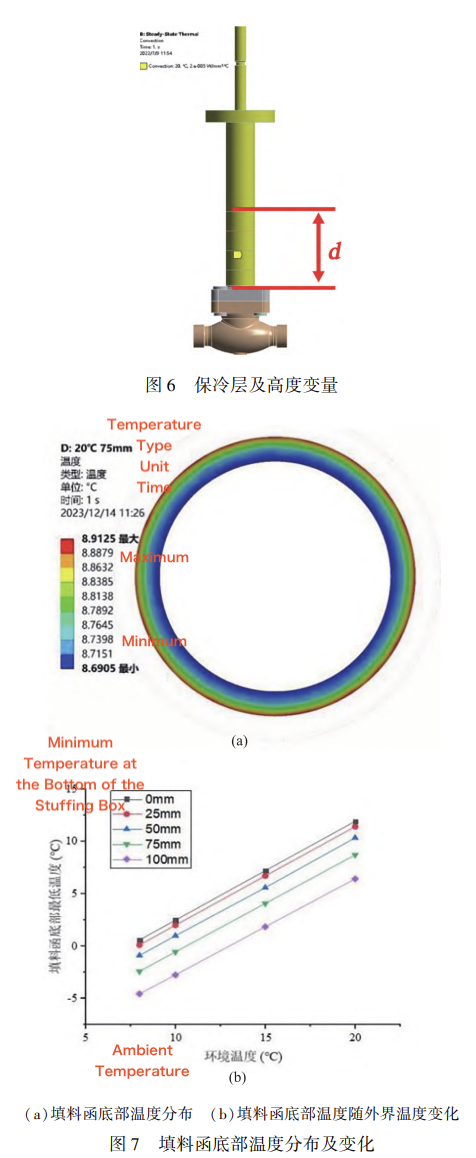
Figure 6. Insulation layer height as a variable
(a) Temperature distribution at the bottom of the stuffing box; (b) Variation in temperature at the bottom of the stuffing box with ambient temperature
Figure 7. Temperature distribution and variation at the bottom of the stuffing box
From the above analysis, the temperature field of the LNG valve exhibits a clear vertical temperature gradient. The overall temperature distribution of the valve is mainly governed by the following factors:
For a given thermal conductivity, increasing the insulation layer height reduces heat ingress into the valve.
The thermal conductivity of the valve materials affects heat transfer through the valve and, consequently, the overall temperature distribution.
A higher ambient temperature increases the temperature difference across the insulation layer, resulting in greater heat transfer through the same surface area and consequently increasing the temperature at the bottom of the stuffing box.
(1) Effect of the Distance Between the Bottom of the Valve Disc and the Positioning Nut on Flow Resistance
Figure 8 shows the variation in the flow resistance coefficient with the distance between the bottom of the valve disc and the positioning nut. As the distance decreases from 40.5 mm to 37 mm, the flow resistance coefficient generally decreases.
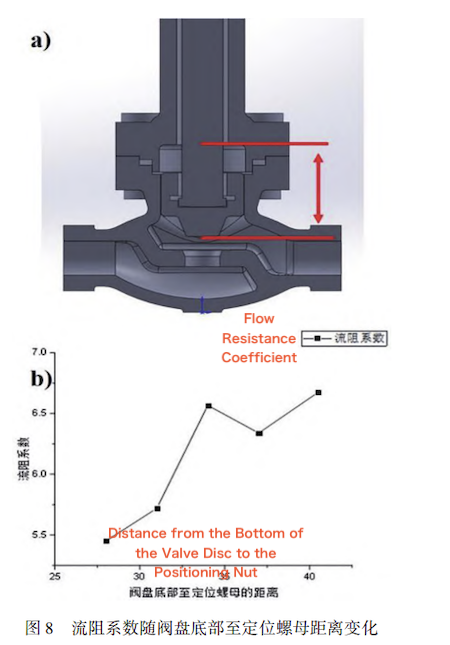
Figure 8. Variation in the flow resistance coefficient with the distance between the bottom of the valve disc and the positioning nut
As shown in Figure 9, reducing this distance decreases the extent to which the valve disc protrudes into the flow passage, thereby reducing flow obstruction and lowering the flow resistance coefficient. Therefore, provided that opening and closing performance is not compromised, the distance between the bottom of the valve disc and the positioning nut can be moderately reduced when the valve is fully open to effectively lower flow resistance. Under these operating conditions, the DN15 valve model achieves the lowest flow resistance coefficient when the distance between the bottom of the valve disc and the positioning nut is 28 mm.
Figure 10 shows the variation in the flow resistance coefficient with the valve disc tilt angle. The flow resistance coefficient generally increases with increasing tilt angle.
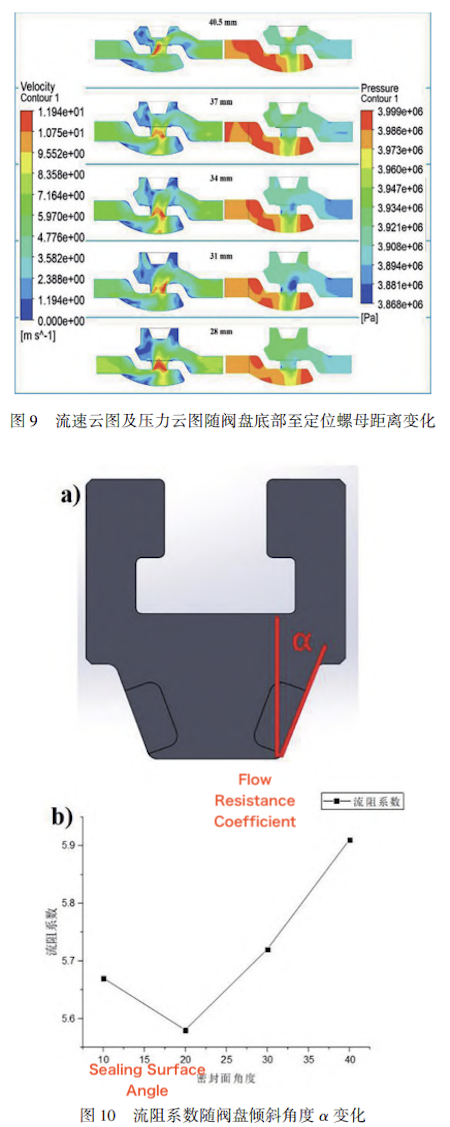
Figure 9. Velocity and pressure contours for different distances between the bottom of the valve disc and the positioning nut
Figure 10. Variation in the flow resistance coefficient with the valve disc tilt angle α
Analysis of the velocity and pressure contours in Figure 11 shows that, as the valve disc tilt angle increases from 10° to 20°, the high-velocity flow path shifts, preventing the flow from impinging on the corner and increasing the cross-sectional area of the high-velocity flow region. Meanwhile, the vortex near the valve disc weakens, reducing its obstruction to the flow and thereby lowering the flow resistance. However, as the tilt angle further increases to 30° and 40°, the valve disc begins to protrude into the flow passage, reducing the effective flow area and increasing the flow resistance. In addition, a vortex reappears on one side of the valve disc, further increasing the flow resistance.
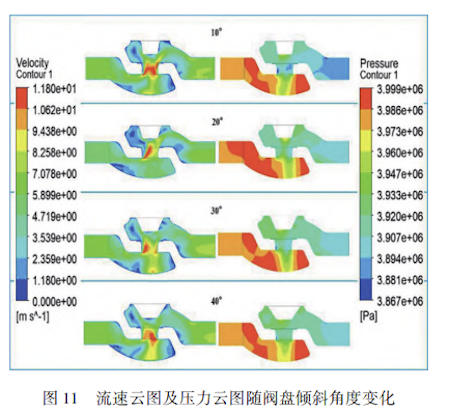
Figure 11. Velocity and pressure contours for different valve disc tilt angles
Therefore, when the valve disc tilt angle is appropriately selected, the flow can avoid impinging on the corner, forming a stable and relatively large high-velocity flow path while substantially reducing flow obstruction caused by vortices. Under these boundary conditions, the valve exhibits relatively low flow resistance when the valve disc tilt angle is approximately 20°.
3.4 Analysis of Closing Performance and Weight Reduction Optimization Considering Thermo-Mechanical Coupling Deformation
In the current valve design, the radius of the valve disc bottom is 12.5 mm, while the valve seat radius is 16 mm. Therefore, the allowable lateral displacement of the valve stem end is theoretically 1.75 mm, beyond which tight closure may be compromised. According to the results shown in Figure 12, the deformation in the X direction remains within the allowable range. Therefore, the valve can still achieve a tight seal.
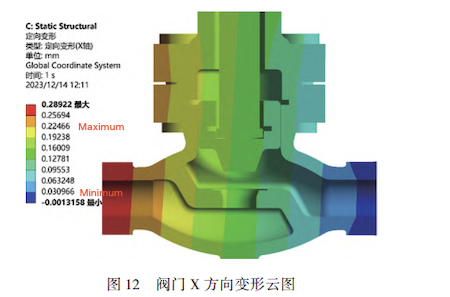
Figure 12. Contour plot of valve deformation in the X direction
Given the substantial mass of the valve body, a comprehensive structural analysis of the body is necessary. In addition, to ensure sufficient structural strength, the maximum working stress in the valve body under external loads must remain below the allowable stress of the material. In strength calculations, the ultimate strength of the material is divided by a safety factor nn greater than 1. The resulting value, which represents the maximum stress permitted under service conditions, is referred to as the allowable stress of the material and is denoted by σ. The allowable stress is expressed as:

CF3M has a yield strength of 350 MPa. Using a safety factor of 1.5, the allowable stress is calculated as 233 MPa. Although the allowable stress increases slightly as the temperature decreases, the change is negligible. Therefore, for the purposes of this analysis, the material can be assumed to remain in the elastic range when the stress does not exceed 233 MPa.
As shown in the valve body stress distribution in Figure 13, the stresses in the valve body are well below the allowable stress, indicating a substantial structural margin. Therefore, the valve body was optimized, as shown in Figure 14. The flange thickness L₁ was reduced from 15 mm to 12 mm, the intermediate partition thickness L₂ from 6.5 mm to 5 mm, L₃ from 7.5 mm to 6 mm, and the wall thickness L₄ from 5 mm to 4 mm. These modifications resulted in an overall weight reduction of 15%.
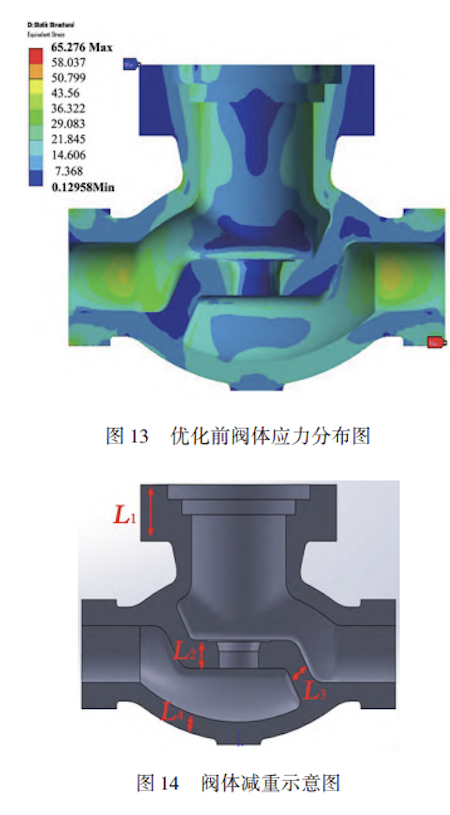
Figure 13. Stress distribution in the valve body before optimization
Figure 14. Schematic of valve body weight reduction
Figure 15 shows the stress distribution in the valve body after optimization. Compared with the original design, the stress distribution is more uniform, and the stress levels remain well below the allowable stress, providing a substantial safety margin and demonstrating that the optimized design maintains adequate structural strength.
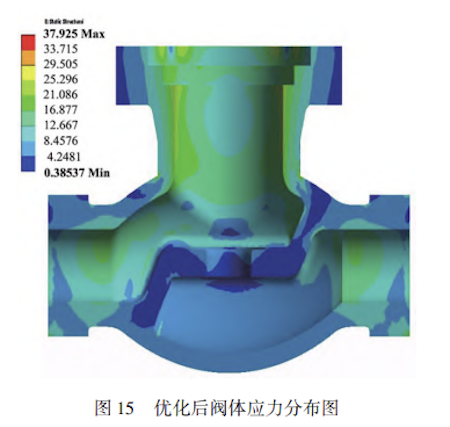
Figure 15. Stress distribution in the valve body after optimization
This study adopts a deeply coupled multidisciplinary approach based on a closed-loop thermo-fluid-structural analysis, combined with integrated optimization for simultaneous weight and flow-resistance reduction. The study first analyzes the temperature field of the cryogenic valve and investigates the effects of various factors on its temperature distribution. The stress distribution and deformation of the valve are then evaluated under the coupled effects of fluid pressure and thermal loads. Finally, the valve is optimized for flow resistance and weight reduction, followed by an evaluation of its shut-off performance after deformation, valve seat sealing performance, and flange sealing performance. The main conclusions are as follows:
(1) Thermodynamic analysis shows that the temperature field of the LNG valve exhibits a clear vertical gradient from top to bottom. The overall temperature distribution is mainly governed by the following factors:
Insulation layer height. For a given thermal conductivity, increasing the insulation layer height reduces heat ingress into the valve.
Material properties of the valve components. Higher thermal conductivity enhances heat transfer through the valve and consequently affects the overall valve temperature.
Ambient temperature. A higher ambient temperature increases the temperature difference across the insulation layer, resulting in greater heat transfer through the same surface area and consequently increasing the temperature at the bottom of the stuffing box.
(2) Fluid dynamics analysis indicates that the flow resistance coefficient is minimized when the distance between the bottom of the valve disc and the positioning nut is 28 mm and the valve disc tilt angle is approximately 20°.
(3) Static analysis shows that, after optimization, the valve body has a more uniform stress distribution, with stresses remaining below the allowable stress and a substantial structural margin. Overall, the optimized design achieves a 15% reduction in valve weight.
This study proposes a multidisciplinary analysis and design optimization approach for cryogenic valves, providing a systematic basis for their design and optimization. The results provide technical support for the development of independent and controllable high-end valve technologies in China.